Mike Shekhtman, P.E., MBA, CMRP, Goodyear Tire & Rubber Co. North American Tire Manufacturing
Reliability > Conversion Costs > Asset Capacity > Business
Most people in the reliability profession probably have heard the saying that the maintenance of today is the capacity assurance of tomorrow. Many in our field would agree that business trends already have taken the industry to that day of the future. Our teams no longer maintain the status quo. What we do is strive to assure our assets’ capacity by constantly optimizing equipment availability to make the product when it is scheduled to be made. We work hard to make sure that machines don’t generate scrap. And we ensure that the equipment runs as close to the expected productions speeds as possible. For today’s capacity assurance managers, overall equipment effectiveness (OEE) works very well as the key performance indicator of our success.
Our business leaders understand the importance of the reliability effort, too. But, they also understand the need to control manufacturing overhead. As a result, they must clearly see how a reliability effort contributes to the bottom line. What’s the best way to make this type of business case?
Keep it simple
A reliability effort does contribute to an increase in the return on assets. The most direct and easy-to-understand impact resides in the expenses section of the income statement. There, it is apparent that the greatest part of the reliability financial benefit lies in the operators home, reassign them to do something else or make conversion costs reduction.
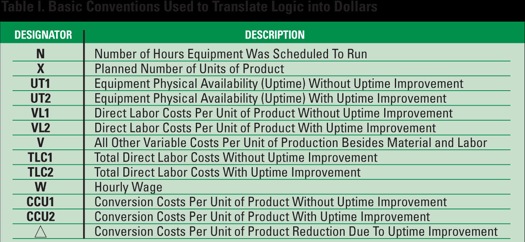
Let’s think in simple terms. We expect a machine to be available for a certain period of time to make a specific number of labor. In other words we achieved a reduction in labor costs per product units. When the hard work of our maintenance teams unit of product or generated additional capacity to make more leads to higher machine reliability, the company spends less units of product without having to account for the labor. time making those expected units of product. The machine Is that simple enough? Let’s see if we can translate that is operational and the operators are standing by. Their labor logic into dollars and cents. The basic conventions that we costs in dollars per unit already are accounted for.
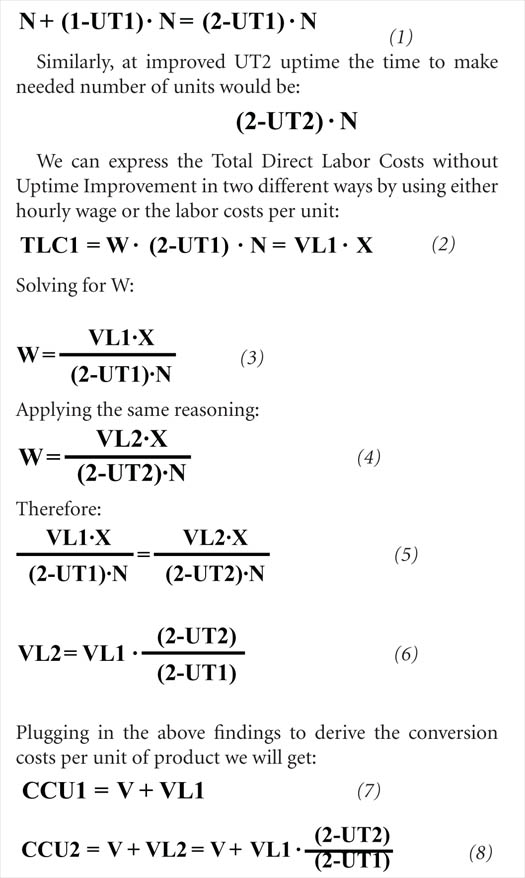
Suppose that a business needed to make X number of product units and scheduled N number of hours to do it. In actuality, however, the equipment only ran at UT1 uptime. So, to make the intended units of product the number of run hours was:
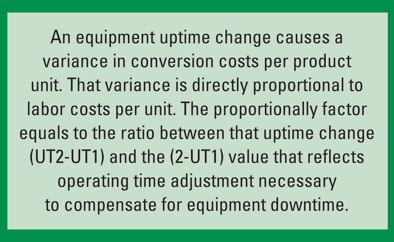
Formula 9 can be expressed in a verbal statement shown in Fig 1.
Any reliability practitioner after looking at that statement and thinking for a few minutes would say: “I knew that!” There is no doubt that it is somewhat intuitive for the insiders. For maintenance and engineering managers, it is quite empowering in that it can be applied to any time interval and any area of the production process or piece of equipment to prioritize the allocation of resources. This statement also appears to be a straightforward tool for quantifying the reliability objectives for the business leadership and showing them the gains triggered by the improved uptime. Let’s demonstrate.
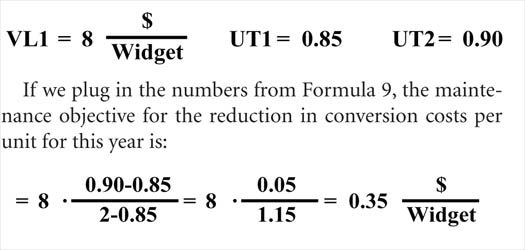
Say, for example, that last year a manufacturing area produced 100,000 widgets at $8.00 of labor costs per every widget and at 85% physical availability or uptime. This means that due to equipment reliability issues the machines ran only 85 out of every 100 scheduled hours. This year, our hypothetical maintenance organization has committed to increasing the uptime to 90% by improving reliability. Then:
Accordingly, the total commitment by maintenance for this year to reduce labor costs and consequently the overall conversion costs at the same production levels of 100,000 caused by either increased or decreased reliability. The widgets is:
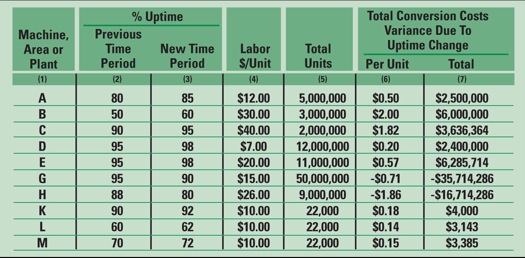
Table II shows a few semi-random examples of calculations.
Since in that scenario fixed costs are assigned to each lated conversion costs variances related to uptime changes unit produced, the same uptime driven proportionality factor that is demonstrated in Fig. 1 can be utilized to derive the fixed costs variance. The improved uptime will demonstrate a favorable variance for the reporting period.
Crunch your own Numbers
It may make for an interesting exercise to apply this approach to a few hypothetical scenarios for your own business—and crunch some numbers of your own. Some results may appear puzzling, though.
One important thing to keep in mind is that the numbers are not constant. What this means, more often than not, is that companies take advantage of improvements in reliability and uptime by making more units of product. That additional capacity without added labor costs translates into higher labor productivity, which prompts lowering the number for the labor costs per unit produced for the next round of calculations. So, ultimately, the model needs to be readjusted for every consecutive time period.
It is possible that such a model can be taken further to try to predict the impact of various reliability trends on the bottom line. It also is possible—especially when analyzed on a smaller scale—that the savings may never materialize into something measurable. But then the numbers can be reported to management as intangible labor productivity gains.
In its present form—with all other factors but uptime being irrelevant—the method seems to be surprisingly simple and elegant. We can choose to analyze a quarter or a month or even a week. We may decide to run the numbers for the separate machines or for the entire plant or multiple plants.
As long as the data being used are accurate, the numerical results will show what the business leadership really needs to know. Hopefully, this will help enable business teams to effectively rank priorities and make the right choices on funding and resource allocation.
Mike Shekhtman is a senior regional reliability engineer for the Goodyear tire manufacturing North American region, based at Goodyear Tire and Rubber corporate headquarters in Akron, OH. Prior to joining Goodyear earlier this year, he had spent 20 years in the manufacturing industry in various capacities in maintenance management and engineering. A licensed Professional Engineer and a Certified Maintenance and Reliability Professional, Shekhtman holds an MSME degree from St. Petersburg State Polytechnic University in Russia and an MBA from Cleveland State University.
Expert troubleshooters have a good understanding of the operation of electrical components that are used in circuits they are familiar with, and even ones they are not. They use a system or approach that allows them to logically and systematically analyze a circuit and determine exactly what is wrong. They also understand and effectively use tools such as prints, diagrams and test instruments to identify defective components. Finally, they have had the opportunity to develop and refine their troubleshooting skills.
Expert troubleshooters have a good understanding of the operation of electrical components that are used in circuits they are familiar with, and even ones they are not. They use a system or approach that allows them to logically and systematically analyze a circuit and determine exactly what is wrong. They also understand and effectively use tools such as prints, diagrams and test instruments to identify defective components. Finally, they have had the opportunity to develop and refine their troubleshooting skills.
Semiconductor devices are almost always part of a larger, more complex piece of electronic equipment. These devices operate in concert with other circuit elements and are subject to system, subsystem and environmental influences. When equipment fails in the field or on the shop floor, technicians usually begin their evaluations with the unit's smallest, most easily replaceable module or subsystem. The subsystem is then sent to a lab, where technicians troubleshoot the problem to an individual component, which is then removed--often with less-than-controlled thermal, mechanical and electrical stresses--and submitted to a laboratory for analysis. Although this isn't the optimal failure analysis path, it is generally what actually happens.
Semiconductor devices are almost always part of a larger, more complex piece of electronic equipment. These devices operate in concert with other circuit elements and are subject to system, subsystem and environmental influences. When equipment fails in the field or on the shop floor, technicians usually begin their evaluations with the unit's smallest, most easily replaceable module or subsystem. The subsystem is then sent to a lab, where technicians troubleshoot the problem to an individual component, which is then removed--often with less-than-controlled thermal, mechanical and electrical stresses--and submitted to a laboratory for analysis. Although this isn't the optimal failure analysis path, it is generally what actually happens.
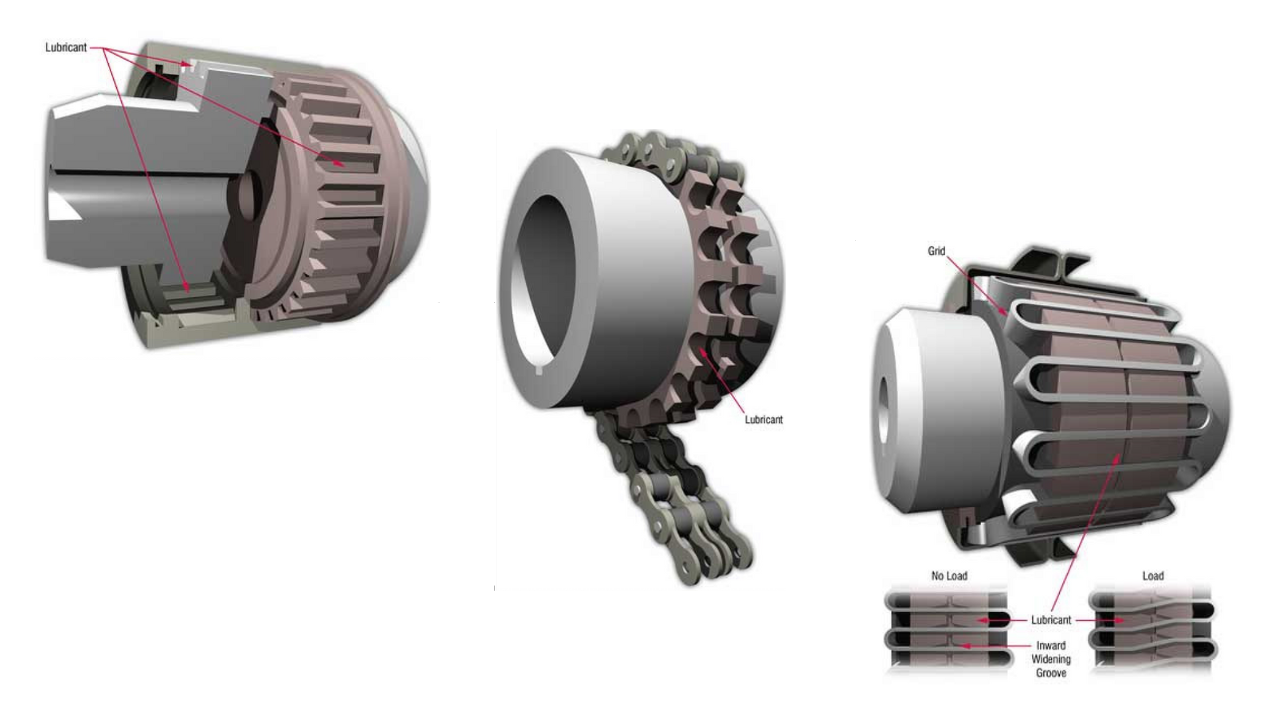
In an ideal world, multiple components could be produced in a single piece, or coupled and installed in perfect alignment. However, in the real world, separate components must be brought together and connected onsite. Couplings are required to transmit rotational forces (torque) between two lengths of shaft, and despite the most rigorous attempts, alignment is never perfect. To maximize the life of components such as bearings and shafts, flexibility must be built in to absorb the residual misalignment that remains after all possible adjustments are made. Proper lubrication of couplings is critical to their performance.
In an ideal world, multiple components could be produced in a single piece, or coupled and installed in perfect alignment. However, in the real world, separate components must be brought together and connected onsite. Couplings are required to transmit rotational forces (torque) between two lengths of shaft, and despite the most rigorous attempts, alignment is never perfect. To maximize the life of components such as bearings and shafts, flexibility must be built in to absorb the residual misalignment that remains after all possible adjustments are made. Proper lubrication of couplings is critical to their performance.
The key to realizing greater savings from more informed management decisions is to predetermine the "True" cost of downtime for each profit center category. True downtime cost is a methodology of analyzing all cost factors associated with downtime, and using this information for cost justification and day to day management decisions. Most likely, this data is already being collected in your facility, and need only be consolidated and organized according to the true downtime cost guidelines.
The key to realizing greater savings from more informed management decisions is to predetermine the "True" cost of downtime for each profit center category. True downtime cost is a methodology of analyzing all cost factors associated with downtime, and using this information for cost justification and day to day management decisions. Most likely, this data is already being collected in your facility, and need only be consolidated and organized according to the true downtime cost guidelines.
I use the term RCPE because it is a waste of good initiatives and time to only find the root cause of a problem, but not fixing it. I like to use the word problem; a more common terminology is Root Cause Failure Analysis (RCFA), instead of failure because the word failure often leads to a focus on equipment and maintenance. The word problem includes all operational, quality, speed, high costs and other losses. To eliminate problems is a joint responsibility between operations, maintenance and engineering.
I use the term RCPE because it is a waste of good initiatives and time to only find the root cause of a problem, but not fixing it. I like to use the word problem; a more common terminology is Root Cause Failure Analysis (RCFA), instead of failure because the word failure often leads to a focus on equipment and maintenance. The word problem includes all operational, quality, speed, high costs and other losses. To eliminate problems is a joint responsibility between operations, maintenance and engineering.
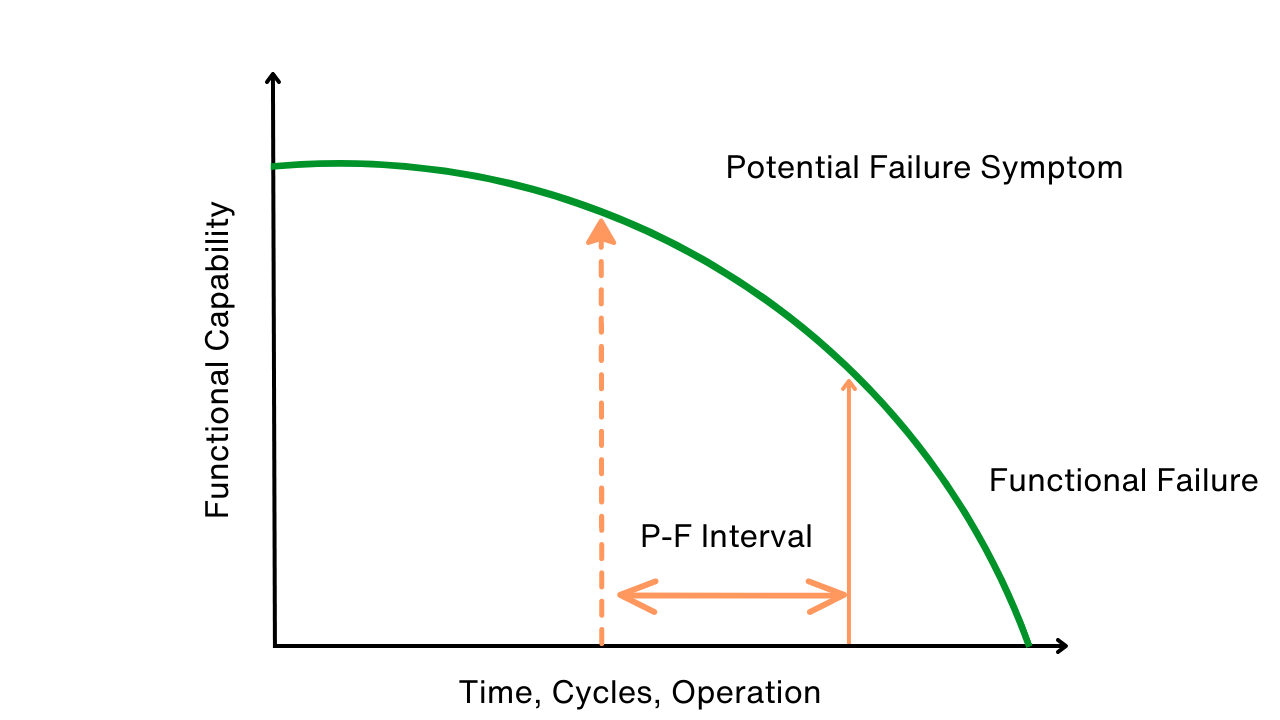
The potential-to-functional failure interval (P-F interval) is one of the most important concepts when it comes to performing Reliability-Centered Maintenance (RCM). Remarkably, the P-F interval is also one of the most misunderstood RCM concepts. The failure mode analysis becomes even more complicated when you are dealing with several P-F intervals for one failure mode. This paper will help clarify the P-F interval and the decision-making process when dealing with multiple P-F intervals.
The potential-to-functional failure interval (P-F interval) is one of the most important concepts when it comes to performing Reliability-Centered Maintenance (RCM). Remarkably, the P-F interval is also one of the most misunderstood RCM concepts. The failure mode analysis becomes even more complicated when you are dealing with several P-F intervals for one failure mode. This paper will help clarify the P-F interval and the decision-making process when dealing with multiple P-F intervals.
As many of us strive to improve the reliability of our plants, several comments bemoan how challenging that is to do in an era of continuous deep cost cutting. They say that in their operation, maintenance is seen as a cost, and is one of the first things to arbitrarily cut. Some think their operations have cut too far! What they seek is a way to justify a strong maintenance capability. I submit that one approach is to speak of maintenance as an “investment in capacity.” Use the language that plant managers, controllers and senior management understands: capital investment and return on investment (ROI).
As many of us strive to improve the reliability of our plants, several comments bemoan how challenging that is to do in an era of continuous deep cost cutting. They say that in their operation, maintenance is seen as a cost, and is one of the first things to arbitrarily cut. Some think their operations have cut too far! What they seek is a way to justify a strong maintenance capability. I submit that one approach is to speak of maintenance as an “investment in capacity.” Use the language that plant managers, controllers and senior management understands: capital investment and return on investment (ROI).