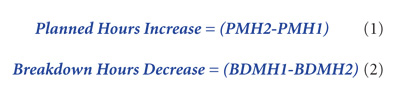
Planned Work Predominance: Contribution to the Bottom Line
Mike Shekhtman, P.E., MBA, CMRP
The method presented here can help bring some much-needed clarity to your objectives.
It’s common knowledge that increasing the share of planned maintenance over the time spent on breakdowns should be a top priority for forward-thinking maintenance organizations. The financial benefits of planned work, however, may not be readily apparent.
Modern industrial operations put great emphasis on planned maintenance. We all are big proponents of preventive maintenance. We put much effort into capturing preventive tasks in CMMS, then tracking, changing, improving and scheduling them, as our equipment systems require. Many of us implement and expand predictive ways of managing our assets. And planned reactive work is always the preferred way of addressing equipment problems, as opposed to fighting fires of unplanned downtime. In other words, anything is better for business than trying to manage unexpected failures.
While we all recognize the importance of and work toward minimizing time spent on machine breakdowns, quantifying the results of what we do is often problematic. Yet, trying to assign a number to what good those precious man-hours of planned work do for us should not be an exception. To that end, let’s explore how some well-known assumptions of “scientific” maintenance can help us measure the benefits of planned work.
Planned work share and resource-availability benefit
A logical place to start is with the important fact that planned maintenance work costs organizations less than trying to mange breakdowns. This is true in more ways than one: If the production delay is planned, the machine operators can be reassigned ahead of time and ripple effects on the operating flow downstream from the machine can be managed better.
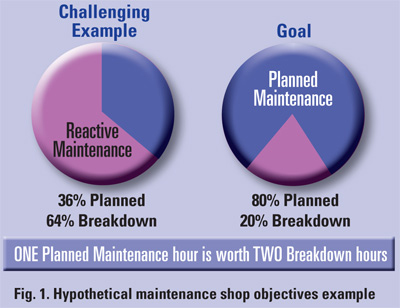
Another assumption is that unacceptable, acceptable, desirable or world-class levels of planned-to-breakdown man-hour ratios can be quantified. Some sources claim a 5 to 95% balance of unplanned-to-planned work to be world-class. Some state that less then a 75% share of planned work is intolerable. For the purposes of this discussion, let’s agree that for an average shop, an 80% planned-maintenance-work to 20% breakdown ratio is highly desirable and makes for a nice long-term goal.
In a 2007 presentation entitled “The New Approach to Plant Maintenance,” ABB Reliability Services suggested that one hour of properly performed planned maintenance avoids three hours of repair work. Depending on maintenance productivity or planned-work “wrench time” effectiveness, the ratio can probably be better than that. At least temporarily, let’s agree on an understatement that every ONE planned-maintenance hour is worth TWO breakdown hours.
Consider the hypothetical example of a rather average maintenance shop with the relatively challenging planned-to-breakdown man-power allocation ratio illustrated in Fig. 1.
At the present time, our hypothetical maintenance shop spends only 36 out of every 100 man-hours on planned work. Say the leadership decides to shift that balance by either hiring more technicians or arbitrarily reassigning some of the existing staff to bump the planned work number up to 37 out of 100 hours. With that additional hour buying a two-hour reduction in breakdown work, the shop suddenly finds itself spending 98 man-hours on what used to take 100 hours to do. If the process of incrementally increasing the planned-work share continues in the same manner, the reduction in breakdown will continue to accumulate (Table I).
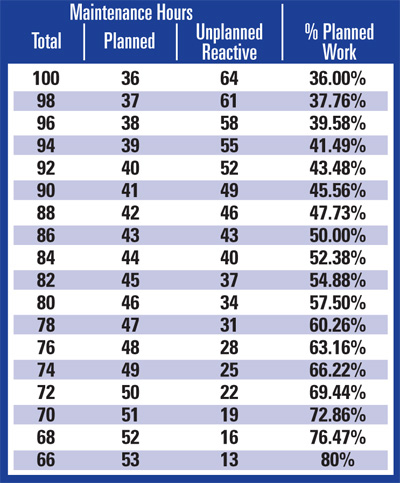
That way, with each one planned-work hour reducing the breakdown hours by two, by the time the shop arrives at the 80% planned-work share, there are only 66 man-hours spent doing 100 man-hours worth of work. Our hypothetical shop has found resources it didn’t know it had.
Quantifying the gains… Total maintenance man-hours after planned work-share increase…
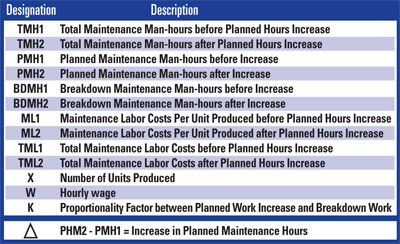
Let’s take things further. We want to see if there’s a way to quantify the effect of the planned work share increase on the maintenance costs. As David Geaslin of The Geaslin Group correctly states on www.geaslin.com, “Just because a maintenance manager cannot predict future maintenance costs does not mean that they cannot produce the lowest maintenance cost per unit of production possible.” Here, we’ll use very basic algebra to come up with some dollar values. The conventions we’re going to start with are listed in Table II.
Note, in the following calculations, that we’re generalizing more with regard to what every additional hour of planned work buys us than we did in our previous hypothetical shop example. Let’s state that:
The planned work-hours increase and corresponding breakdown-hours decrease can be expressed as:
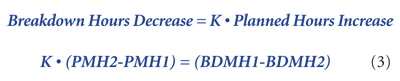
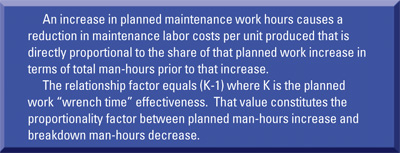
The proportionality factor defined above as K gives us the relationship between the two:
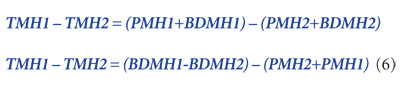
The total number of man-hours before and after the planned-work improvement is the sum of all hours worked:

Thus, the overall reduction in maintenance man-hours is:

Plugging in formulas (4) and (5) for the total decrease in man-hours and manipulating equation members algebraically, we get:
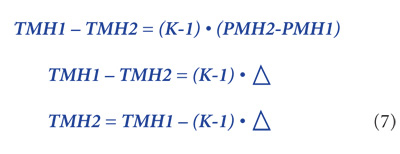
Substituting in formula (6) for breakdown-hours decrease (2) with what we agreed on in formula (3), we get:

Shifting the members around a bit and giving a name Δ to the planned-hours increase (1) per conventions in Table II, we can derive a new expression for the total maintenance man-hours after the planned-work share was increased:
Quantifying the gains: Expressing total man-hours in terms of either wage or cost per unit and the consequent maintenance labor cost per unit decrease expression…
Maintenance labor costs can be expressed in two ways. First, we’ll use hourly wage that is not affected by anything we do with the work-type balance and total man-hours worked. Then with the Table II conventions, for both before and after the planned-work increase we can say:
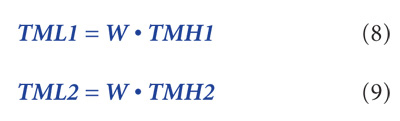
Secondly, if we multiply the maintenance costs per unit produced by the number of units we get same values:
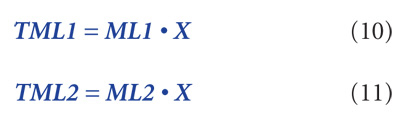
Now, we can respectively equate (8) and (10), and (9) and (11):

Deriving the wage value from both equations:

Therefore:
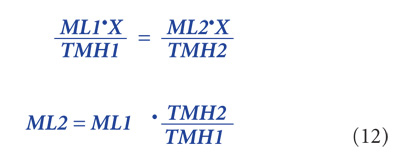
Substituting in (12) for the value of the total maintenance man-hours after the planned-work increase TMH2 as derived in the formula (7)
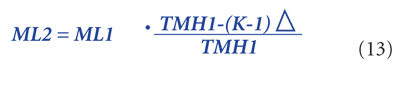
We have thus found the way to express the new maintenance costs per unit of product in terms of initial costs—but without using either the hourly wage or the number of units produced.
Quantifying the gains: Expressing the decrease in maintenance labor costs per unit pro-duced in terms of the increase in planned maintenance work hours as the percentage of total man-hours prior to that increase…
Now, by subtracting the new maintenance labor cost per unit produced as per formula (13) from the initial one, let’s see how the improvement can be expressed:
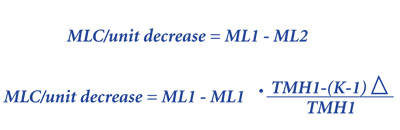
Then, after some simplification:
Expressing the improvement in maintenance labor cost per unit produced as percentage of that cost before the planned-work hours increase:

But per the definition of Δ from Table II:

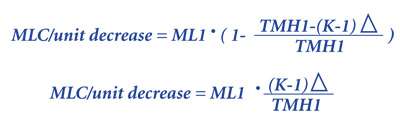
If we look closely at what’s on the right side of the equation (15), it shouldn’t take long to recognize that it is the increase in planned maintenance work hours PMH2-PMH1, expressed in terms of the percentage of TMH1, the total man-hours prior to that increase. That being the case, the equation (14) can be expressed as follows:

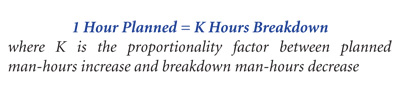
Formula 16 can be expressed in a verbal statement, as shown in Fig 2.
Quantifying the gains: Numerical examples of the decrease in maintenance-labor costs per unit produced in terms of the increase in planned-maintenance work hours, as the percentage of total man-hours prior to that increase…
Let’s go back to the previously-mentioned hypothetical maintenance shop with only 36 of every 100 man-hours allocated to planned work and the shop’s leadership effort to boost the share of the planned work. Our newly developed method enables us to estimate the maintenance labor-costs reduction in the shop’s journey to reach the 80/20 balance.
We agreed initially that every ONE planned maintenance hour in the shop is worth TWO breakdown hours. That renders the planned work “wrench time” effectiveness K proportionality factor as 2.
An assumption will have to be made as to where the shop stands with the K planned-work-effectiveness value of equation (16), that proportionality factor between planned man-hours increase and breakdown man-hours decrease. Let’s try three various scenarios, starting with our already reviewed example of K =2, then continuing with K=3 and K=1.5. The results are shown in Table III.
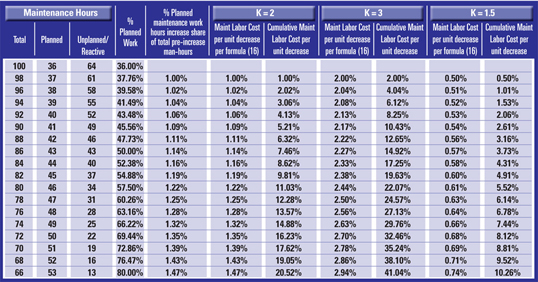
The bottom row of Table III shows that by the time our hypothetical shop with K=2 reaches the 80/20 planned-versus-unplanned maintenance-work balance, its maintenance- labor cost per unit will cumulatively decrease by 20.52%. Had the effect of the planned-work increase on the reduction in breakdown hours been more pronounced with the K factor of 3, then the cumulative decrease of maintenance labor cost per unit of product would have been at 41.04%. If the shop’s planned work had been a bit less effective with the proportionality factor K conversely equating to 1.5, it would result in a cumulative 10.26% reduction of those costs.
Building your own business case
It’s no secret that if we find the way to translate our technical team’s effort into the language of dollars and cents our company leadership will be more receptive to investing more into that effort. Consequently, with the method and the hypothetical assumptions described above—or without them—marketing “scientific” maintenance is a must. It becomes more or less a daily task to understand and communicate to decision-makers the connection between lifecycle costs of equipment, the equipment’s performance and its consequent throughput with the costs of maintenance per unit of production.
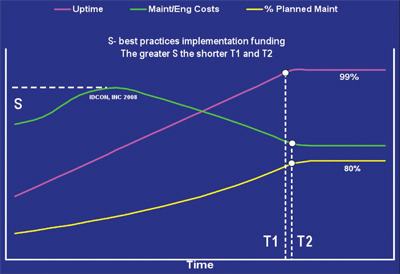
As business people, we need to make it clear to our leadership and ourselves that to reach optimal levels of both costs and performance, additional spending above regular labor and material will be needed. Lecturers from IDCON INC often speak of a “maintenance-costs curve” and its initial hump. That hump and delay of the downward slope can be easily seen in Fig. 3, which depicts what dependency of both 80/20 planned-work-share effort and the hypothetical machine uptime curve from maintenance costs may look like.
Saying “yes” to this approach…
- Yes, “scientific” maintenance over time will increase our equipment uptime. What that optimally obtainable uptime is will depend on the age of our machines, age, level of general machine decay and whatever time has elapsed since the last major upgrade or overhaul.
- Yes, the arbitrary, forced and continuous shift from breakdown maintenance to planned maintenance will affect how quickly our organization reaches that optimal uptime of the equipment.
- And yes, maintenance costs will eventually decrease with the continuous increase of planned work-share on our shop floor, along with the improvement of our machines’ performance. But to reach the optimal levels of reduced costs, greater planned work-share and improved equipment performance, an organization company needs to invest in planned-maintenance Best Practices (i.e., boosting both the resources allocated to planned maintenance and the effectiveness of planned-work “wrench time”). That investment might be hiring more craftsmen to do the planned work or paying more for predictive tools and services. It might be putting in place just the right number of well-trained and dedicated planners and giving them the right (modern) tools to help assure optimal planned-work “wrench time” effectiveness. Or, the investment might simply be taking a leap of faith to increase maintenance planned man-hours and temporarily accept potentially greater levels of downtime as personnel are reassigned from “watching machines run/waiting for them to go down” to PM, PdM, running inspections or other planned work.
The stronger the funding for best practices, the sooner an operation will achieve that noble goal of 80/20 maintenance, the hypothetical goal of 1% equipment downtime and the lowest obtainable maintenance costs.
So, build the business case for your planned-maintenance work contribution to the bottom line, prove your point to management and secure the needed resources. Then, all you have to do is assure that the planned work is as effective as possible—and deliver on the premise.
Mike Shekhtman is a Regional Manager of Maintenance and Reliability for the North American region of Goodyear’s tire manufacturing operations, based at The Goodyear Tire & Rubber Company’s headquarters in Akron, OH. He spent 24 years in the manufacturing industry in various capacities in maintenance management and engineering. A licensed Professional Engineer and a Certified Maintenance and Reliability Professional, Shekhtman holds an MSME degree from St. Petersburg State Polytechnic University in Russia, and an MBA from Cleveland State University. Telephone: (330) 796-7245; email: [email protected].
Related Articles

A Planner's Tool Kit

Uptime: Fill Out Work Orders? Who's Got Time for Paperwork?

Tips for Maintenance Planning
Centralized Maintenance vs. Decentralized

You Cannot Maximize Production or Reduce Costs Without the use of an Effective Planned Maintenance System

Work Order Prioritization