Reduced Wear and Failure of Machine Components: Failure Analysis of Mechanical Components
Neville Sachs, President of Sachs, Salvaterra & Associates, Inc.
Reduced Wear and Failure of Machine Components
Examples of failure analysis of mechanical components are almost everywhere. Reduced wear and failure of machine components are a common occurrence, whether it is a minor maintenance failure or a disaster of national significance, anyone can learn from analyzing mistakes.
Can you imagine professional football teams not using videotapes to improve their performance? Baseball players or golfers not analyzing their swing? Or a manufacturer not trying to improve its product?
We first became involved in failure analysis as part of a large-scale predictive maintenance program in 1974. Using vibration and shock pulse monitoring, we routinely defected failing motor bearings and many other problems. However, motor life did not actually improve until we began a program of failure analysis. The rewards were tremendous; in a plant with 2200 motors, average motor life more than doubled.
Some components, for example, brake shoes, belts, and chains, slowly fail from wear over several years; other parts, such as bolts, shafts, and machine frames, should never fail. Understanding how the parts fail shows what has to be done to prevent a recurrence. Every failure leaves clues as to why it happened.
In more than 90 percent of industrial cases a trained person can use the basic techniques of failure analysis to diagnose the mechanical causes behind a failure, without having to enlist outside sources and expensive analytical tools like electron microscopes. Then, knowing how a failure happened, the investigator can pursue the human roots of why it happened.
There are times, however, when 90 percent accuracy is not good enough. When personal injury or a large loss is possible, a professional should guide the analysis of reduced wear and failure of machine components.
The First Law of Good Maintenance
“In maintenance, when you get really good at something, you’re doing it much too often. There has to be a better way, and it’s time to do a serious failure analysis,” says Jim Schutt, a former maintenance manager and now a corporate executive with Allied Signal.
The Downside – Failure Analysis of Mechanical Components
Combining effective failure analysis with a good predictive maintenance program usually results in huge benefits. Depending on the type of facility, it can not only reduce maintenance costs by 20 to 30 percent, but also increase production by similar values. However, it does require a cultural change.
Four years after a failure analysis program was started in a large heavy industrial plant, one of the mechanics said, “The problem with this place is that there aren’t any hero jobs anymore.”Most plant maintenance personnel derive job satisfaction from solving problems. An effective RCFA program will substantially reduce those problems, so alternative sources of job satisfaction have to be found.
To interpret a failure accurately, the analyst has to gather all pertinent facts and then decide what caused them. To be consistent, the analyst should develop and follow a logic path that ensures a critical feature will not be over looked. The following steps should be taken:
- Decide what to do: How detailed an analysis is necessary? Before starting, try to decide how important the analysis is. If the failure is relatively insignificant, in cost and inconvenience, it deserves a cursory analysis; the more detailed steps can be ignored. But this strategy increases the chance of error. Some failures deserve a 20-minute analysis with an 80% probability of being correct, but critical failures require true root cause failure analysis (RCFA), in which no questions are left unanswered. RCFA may require hundres of man-hours, but it guarantees an accurate answer.
- Find out what happened: The most important step in solving a plant failure is to seek answers soon after it happened and talk to the people involved. Ask for their opinions, because they know the everyday occurrences at their worksite and their machinery better than anyone. Ask questions and try to get first person comments. Do not leave until you have a good understanding of exactly what happened and the sequence of events leading up to it.
- Make a preliminary investigation: At the site, examine the broken parts, looking for clues. Do not clean them yet beacuse cleaning could wash away vital information. Document the conditions accurately and take photographs from a variety of angles of both the failed parts and the surroundings.
- Gather background data: What are the original design and the current operating conditions? While still at the site, determine the operations conditions; time, temperatures, amperage, voltage, load, humidity, pressure, lubricants, materials, operating procedures, shifts, corrosives, vibration, etc. Compare the difference between actual operating conditions and design conditions. Look at everything that could have an effect on machine operation.
- Determine what failed: After you leave the site and the immediate crush of the failure, look at the initial evidence and decide what failed first–and what secondary failures resulted from it. Sometimes these decisions are very difficult because of the size of analysis that is necessary. Find out what changed. Compare current operating conditions with those in the past. Has surrounding equipment been altered or revised? (Two failure examples on my desk have their mechanical roots in changes that took place years before the parts actually failed.)
- Examine and analyze the primary failure: Clean the component and look at it under low-power magnification, 5x to 50x. What does the failure face look like? From the failure face, determine the forces that were acting on the part. Were conditions consistent with the design? With actual operation? Are there other cracks or suspicious signs in the area of the failure? Important surfaces should be photographed and preserved from reference.
- Characterize the failed piece and the support material: Perform hardness test, dye penetrant and ultrasonic examination, lubricant analysis, alloy analysis, etc. Examine the failed part and the components around it to understand what they are. Check to see if the results agree with design conditions.
- Conduct detailed chemical and metallurgical analyses: Perform hardness test, dye penetrant and ultrasonic examination, lubricant analysis, etc. Examine the failed part and the components around it to understand what they are. Check to see if the results agree with design conditions.
- Determine the failure type and the forces that caused it: Review all the steps listed. Leaving any questions unasked or unanswered reduces the accuracy of the analysis.
- Determine the root causes: Always ask, “Why did the failure happen in the first place?” this question usually leads to human factors and management systems. Typical root causes like “The shaft failed because of an engineering error” or “The valve failed because we decided not to PM it” or “The shaft failed because it was not aligned properly” expose areas where huge advances can be realized. However, these problems have to be dealt with differently; people will have to recognize personal error and to change the way they think and act.
Definitions: Reduced Wear and Failure of Machine Components
- Failure – when a person or component no longer performs as intended.
- Primary Failure – the component that failed first and then caused secondary failures. Primary failures can usually be detected and monitored before they fail catastrophically. For example, a failure bearing may be the monitorable item that will, if neglected, eventually result in the secondary failure, the destruction of a gearbox.
- Failure Investigation – an analysis of why something happened that does not delve as deeply into the causes as RCFA. As a result, the probability of an inaccurate diagnosis increases.
- Fracture Face – the exposed surface where the failure actually progressed across the piece. Root Cause Failure Analysis – thorough analysis to find out why a failure occurred. It typically reaches into the human and management systems that allowed the failure to happen.
- Stress Concentrations – physical features that cause the apparent local stress in a part to be greater than the average across the piece. They can result from changes in shape, from defects, and from changes in metallurgy, and they can increase the local stress tenfold.
| Fatigue Strength | AISI 1020 | AISI 4140 |
| Tensile Strength, PSI | 60,000 | 150,000 |
| Yield Strength, PSI | 42,000 | 120,000 |
| Fatigue Strength (Clean and Dry), PSI | 30,000 | 80,000 |
| Fatigue Strength, Mild Corrosive, 106 Cycles, PSI | 12,000 | 20,000 |
| Fatigue Strength, Mild Corrosive, 109 Cycles, PSI | 7,000 | 7,000 |
Types of Failure
Different analysts use difference systems, but the most practical way for plant people to categorize failures is by overload, fatigue, corrosion-influenced fatigue, corrosion, and wear.
Overload: Applying a single load causes the part to deform or fracture as the load is applied.
Fatigue: Fluctuating loads over a relatively long time causes this type of failure and usually leaves clues.
Corrosion-influenced fatigue: Corrosion substantially reduces the fatigue strength of most metals and eventually causes failure at relatively light loads.
Corrosion: The failure is the result of the electrical or biological action of the corrosion, causing a loss of material.
Wear: A variety of mechanisms result in loss of material by mechanical removal
Corrosion and wear are complicated subjects and beyond the scope of this article; however, they will be covered in future articles.
Overload Failures
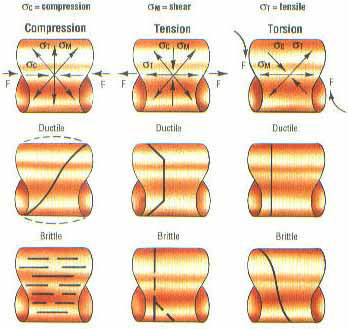
Overload failures are a type of reduced wear and failure of machine components that happen immediately as the load is being applied. The two common forms of overload failures, ductile and brittle, have very different appearances, Figure 1.
of overload failure affect the appearance face.
The most important point to understand when doing failure analysis on a fractured part is that the crack always grows perpendicular to the plane of maximum stress. However, both the nature of the material and the type of failure affect the appearance of the failure face. A compressive overload on a ductile material, for example, a low carbon steel nail, causes the nail to bend. But if that same type of overload were applied to more brittle material, like drill steel or some types of cast iron, it would shatter. Figures 1, 2, and 3 show three ways in which ductile and brittle materials react differently to the same forces because they create different internal stresses.
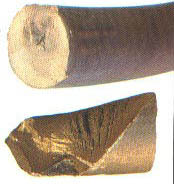
Both were severely overtorqued, but they have
very different appearances. The top shaft is ductile and
has twisted off, and the bottom one shows brittle fracture.
brittle fracture always point to where the crack started.
In the failure of a 5 ½ inch diameter agitator shaft, the keyway looked like a barber pole. The shaft was made from AISI 1020, a low-strength, very ductile carbon steel. It had twisted through six complete revolutions before the final failure. Ductile material of this type frequently allows a great deal of deformation, but with brittle materials there is essentially no deformation. Brittle fracture pieces frequently look as if they could be glued back together.
There are often “chevron marks” on the face of a brittle fracture that show the progression of the failure across the piece. These chevrons or “arrows” always point to where the crack started, Figure 3.
Fatigue Failures
Fatigue is the primary failure mode for more than 90 percent of mechanical failures. The term originated during the 1800s when it was thought that metal parts failed because, like our muscles, they grew tired after long use. Actually, fatigue failures are caused by repeated stress cycles, that is, by fluctuating stress. Four points are important to understanding fatigue:
- Without stress fluctuations fatigue cannot happen.
- Fatigue happens at stress levels well below the tensile strength of the material.
- Where corrosion is present, the fatigue strength of metals continuously decreases.
- The crack takes measurable time to progress across the fracture face.
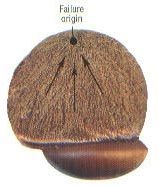
Interpretation of the failure face can disclose the forces that caused the crack, the amount of time elapsed from initiation to final failure, the relative size and type of the load, and the severity of the stress concentrations. The features of a typical fatigue failure face and their significance are shown in Figure 4.
disclose the forces that caused the crack, the amount
of time elapsed from initiation to final failure,
the relative size and type of the load,
and the severity of the stress concentrations.
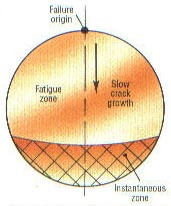
In a fatigue failure the fracture face always shows separate slow and fast failure zones. Figure 5 shows the face of an actual bolt failure. The crack slowly progressed across the shaft face from the point of origin until it reached the boundary of the fast failure (or instantaneous) zone. At this point crack growth accelerated tremendously and traveled the rest of the way at extremely high speeds.
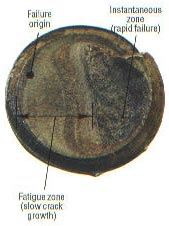
the fatigue zone, and then very rapidly
crossed the instantaneous zone.
The rate at which the crack grows across the face of the part varies with the load on the part. It may take only a few cycles, but in most industrial applications it takes millions of stress applications before the part finally breaks. On a 3600 rpm motor the interval may be only a day, but on a large mixer or press shaft it may be months or even years.
When the amplitude of the stress fluctuations changes, it frequently causes a phenomenon called beachmarks. A typical example is shown in Figure 6. These beachmarks show how the fatigue loads varied during the life of the failure. Frequently, significant load changes show up as beachmarks that can be read as though they were the rings on a tree.
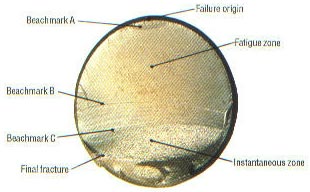
grew for a short time, and then stopped at
beachmark “A” for a long time. Across the
fatigue zone the crack grew slowly and uniformly.
At beachmark “B” it stopped growing for a while
because the stress level was reduced.
During the next period of growth the machine
was alternately run at very high and moderate
loads. When the loads decreased, at beachmark “C”,
the crack stopped growing for a while.
The final fracture shows a heavily loaded bolt.
Electron microscopy can be used to view the fatigue zone in many materials and estimate the number of cycles the crack took to cross the fatigue zone. However, in a more practical vein, a visual inspection of the face also can be used as a guide. The older the crack, the smoother the fracture surface. This rule is complicated by the type of material because fine grained materials, like heat-treated steels, tend to have smoother cracks, but similar materials can be compared.
Figure 7 shows a bolt that failed from fatigue. The relative size of the fatigue and instantaneous zones tells how heavily loaded the part was. If the small area held the final load, the bolt that failed from fatigue. The relative size of the fatigue and instantaneous zones tells how heavily loaded the part was. If the small area held the final load, the bolt was not heavily loaded. If conditions were reversed – small fatigue zone and large instantaneous zone – it would show that much more strength was needed to carry the load and the part was heavily loaded.The fatigue failure show in Figure 7 resulted from one-way bending, the kind of stress a floor beam or a leaf spring may be subjected to. Because the stress was most severe on one side of the part, the cracks started at one point and grew uniformly across it. Other types of stresses cause different failure appearances. For instance, the gear tooth in Figure 8 shows the effect of two-way bending, because it was loaded in both directions. The unequal size of the fatigue zones shows that the stress in one direction was greater than the stress in the other.
In terms of reduced wear and failure of machine components, fasteners, bearings, and shafts are the most common victims of fatigue. Fastener failures are usually caused by fluctuating tension loads and look very similar to the bending failures shown in Figure 8. Bearings usually develop fatigue cracks parallel to the rolling surfaces, and shafts almost always fail from reversed (rotational) bending.
Figure 8. The less heavily loaded side has two failure origins, and the more heavily loaded side shows that cracks started at several points and worked across the face. The unequal size of the fatigue zones shows that the stress in one direction was greater than the stress in the other.
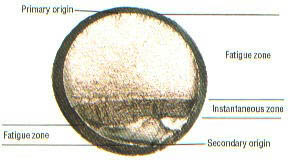
If rotational bending occurs and each part of the shaft is first exposed to tension and then to compression, such as a motor shaft subjected to side loads (like a belt drive), the crack could start anywhere on the surface. Because of the rotation, as it progressed across the face it would grow more on one side than the other. As a result, the bisector of the instantaneous zone would point off to one side of the origin, Figure 9.
Figure 9. If rotational bending occurs and each part of the shaft is first exposed to tension and then to compression, the crack could start anywhere on the surface. As the crack progressed across the face it would grow unevenly because of the rotation. As a result, the bisector of the instantaneous zone would point off to one side of the origin.
However, if the shaft were more heavily loaded or if stress concentrations were present, cracks would start from a number of points around the shaft, Figure 10.
Figure 10. Heavily loaded shaft was subjected to rotational loading. It also had a severe stress concentration all the way around that caused the many failure origins.
Stress concentrations increase the stress in one area so it is much higher than the average stress in the part. One example of stress concentration is the transition area in a bolt from the straight shank to the threaded section. The relatively high stress concentration in this area is the reason most bolts fail at the first thread off the shank.
Figure 11 shows a crack that starts at a keyway, a stress concentration where the stress is about four times that in the rest of the shaft. The benchmarks show how the crack progressed across the shaft, and the comparative sizes of the fatigue and instantaneous zones show the relative size of the load.
Figure 11. The crack origin was caused by stress concentration from the keyway. Eccentric growth pattern shows the shaft was rotating in the direction of the arrow.
Corrosion and Wear
Corrosion has a tremendous effect on the fatigue strength of metals. Most fatigue failures are affected by it. Corrosion acts like stress concentrations; as it progresses, the fatigue strength of the materials continuously decreases.
The fatigue strength of ferrous materials listed in most textbooks is based on either 1 million or 10 million cycles operated in a clean, dry environment. Unfortunately, an 1800 rpm motor operating continuously rotates almost a billion cycles a year and is rarely in that textbook environment.
Figure 12. Jagged, detached and irregular cracks are a sure sign of an unusual metallurgical problem.
The accompanying table shows how the fatigue strengths of two common metals are reduced by corrosion. Even though the AISI 4140 material is much stronger than the mild steel in the beginning, its fatigue strength drops off until, after a year’s operation at 3600 rpm, the two materials are equals. This rapid drop-off is typical of the deterioration that high-strength materials. How should you repair a corroded, pitted shaft that is exposed to fatigue loads? Machine it down to clean steel and put a protective coating on it. Even if you reduce the diameter of the shaft by 10 to 15 percent, the newly exposed shaft material is as strong as when the part was new, and the net effect is a much stronger repair than if it were left corroded – and weakened by the effects of the pits.
Special Cautions for Reduced Wear and Failure of Machine Components
As stated earlier, the mechanical roots of about 90 percent of all failures can be determined without sophisticated analyses. But there will always be some, like those involving safety, that have to be analyzed in great detail.
In addition, failures with jagged or branched cracks, like the stress corrosion cracks show in Figure 12, must be analyzed carefully. Stress corrosion cracking its close cousin, hydrogen embrittlement, result from chemical interactions with metals and can cause catastrophic failures with little or no warning. Branched cracks are cause for suspicion; they are usually a symptom of a serious material application problem.
The last caution is “Never leave a failure analysis with questions about how something happened”. It is impossible to convince others of your skills as a detective if there are gaping holes in your case.

Neville Sachs
Neville Sachs, P.E., is President of Sachs, Salvaterra & Associates, Inc. The consulting firm specializes in improved plant and equipment reliability and technical support services. Previously, Neville was Supervisor, Reliability Engineering for AlliedSignal Corporation where he was instrumental in developing one of the first large predictive maintenance inspection programs in the nation. Mr. Sachs received Bachelor of Engineering Degrees in both Mechanical and Chemical Engineering from Stevens Institute of Technology. Mr. Sachs is also one of RCI’s co-presenters of their Root Cause Analysis Techniques Seminar and is one of their source experts for their RCA Facilitation Services.
Related Articles
Use P-F Intervals to Map, Avert Failures

The RCM Trap


Can You Really Justify Reliability Centered Maintenance (RCM)?

Design for Maintainability