Developing and Implementing an Infrared Predictive Maintenance Program
Carl Schultz, Westar Energy www.mt-online.com
Efforts add value, improve safety and reliability.
A comprehensive infrared predictive maintenance program can improve plant safety and reliability through early detection of equipment problems. Westar Energy’s management in Topeka, KS, made a decision that predictive maintenance would become an integral part of its day-to-day operations, and thermography would be a key component of this new program. The thermography program would span several fossil fuel energy centers that encompass 13 generators producing more than 4165 MW of electricity.
This article will explore the challenges and successes associated with the development and implementation of thermography within Westar’s PdM program.
Beginnings In mid-2000 Westar Energy hired its first PdM manager, who began evaluating thermography and the equipment associated with the technology. He also started to review the methodologies that would be used for the program, and found it was imperative that the entire program be networked across the Westar facilities.
Through early to mid-2001, the thermography program began to take shape. It was decided that the thermographer position would be filled from the existing workforce. The thermography equipment was purchased and an electrical foreman accepted the position of thermographer. This seemed to be a good fit because the foreman had some thermography experience along with its application within a power plant.
However, it became apparent that many factors for the successful integration of thermography into the overall PdM program were missing. Since Westar Energy was looking for an extremely efficient and thorough rollout of the thermography portion of the PdM program, it demanded both expertise and experience.
In mid-2001 changes were made within the program at both the management and analyst level. Outside experience became Westar’s focus and a decision was made to assemble a team that had the experience and expertise needed to build and implement a best-in-class PdM program overall, including a solid thermography program.
The launch By October 2002, a second PdM manager and an experienced thermographer were hired to lead the program implementation. First on a rather long list of tasks was building the thermography databases and data collection routes.
Uniformity within the entire PdM program was determined to be paramount. These databases and routes had to emulate vibration collection methods and utilize the software package used by the vibration side of the program. The vibration analysts were using data collectors and completing both field analysis and post processing within a specific software/firmware framework. All options were explored to emulate this process, including a re-evaluation of infrared components within the vibration software/firmware framework. This proved to be quite a challenge.
The first step in building the databases was the determination of what would be inspected. The initial criteria for the specified inspection points was the inclusion of critical station power components that had a direct impact on generator operation, including all 480 V load center unit substations (LCUS), secondary unit substations (SUS), and motor control center (MCC) battery and dc backup systems. Plant substations and switchyards also were included in these databases.
Next, we acquired as many current one-line drawings as possible for all the systems. All drawings that were available were gathered, copied, and laminated. In cases where the drawings were not readily available, a comprehensive plant walk down was required to generate the inspection list.
Finally, all data was compiled and entered into the software in a similar nature as the vibration databases. The only difference is that most vibration database structures are between three and four levels deep within their database tree while the thermography database is only two levels deep within its database tree structure.
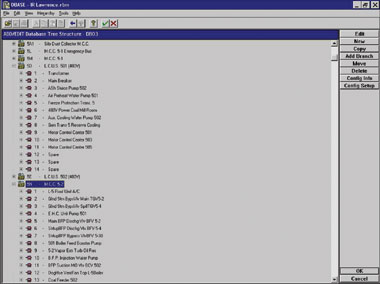
Each plant now had its own database of electrical gear as it related to plant criticality. These databases were originally constructed with unique IDs and then numerical IDs for individual buckets and components as shown in Fig. 1.
We also built route lists for each plant within MS Excel by importing data trees from the software. These route lists were used to check the accuracy of the plant-provided one-line drawings and grid walk downs. The route list was used also as a checklist to log what was inspected, not inspected, tagged out/locked out, date of inspection, anomaly (if found), and to note any re-inspection and date of re-inspection. They would also become the standard by which the routes were run. Nevertheless, refinement of these routes and lists would become inevitable.
Decision on reports The prime objective of any thermography program is to get reports into the hands of the person who must make the repair. Image analysis templates were built in the camera manufacturer’s analysis and reporting software. Due to the desire for program uniformity, the decision was made to use the camera software for image analysis only, and to write the reports from within the vibration software platform. Likewise, field notes pages also were developed.
The amount of data needed for accurate anomaly reporting would not fit on the wav file for the image, and would have to be transcribed from the image at one time or another. Therefore, the use of field notes was adopted. The images would be captured in the field using a standard set of camera parameters, field notes page, digital camera for normal daylight photo, and route lists printed in hardcopy to log all inspection points.
Analysis of the gathered data then would take place at the office and updates to the log pages would be made at that time. Reports were written within the vibration software platform and converted to an MS Word document for distribution and attached to a computerized maintenance management system (CMMS) work order. At this point, it became apparent that some streamlining efforts were needed.
The Word file attachments would print also when the work order was printed. The work orders are tracked in the CMMS by the thermographer throughout the entire process of creation, activation, scheduling/planning, execution, closeout, and recheck. This recheck is completed during the next regular inspection cycle. If the component is extremely critical the recheck is done immediately upon completion of the work order.
Current procedures call for a full thermal inspection of the electrical distribution system every 6 months during the second and fourth quarters to correlate data and work orders with annual outage needs. This also allows a certain amount of flexibility within the infrared inspection schedule for changes and emergencies and still allows sufficient time for results to be entered into the outage schedules for the individual facilities. See “Total Thermography Images to Date.”
One year later As the first phase was completed and all facilities had been inspected one complete time, we now had a baseline of our routes, equipment, and imaging procedures. At the same time, we were developing Westar Energy-specific temperature guidelines and exploring other applications.
The routes were refined, equipment locations and nomenclature confirmed and existence of, or changes to, equipment was noted on the log sheets and updated on the route lists. All electrical equipment contained within a route now conformed to IEEE listing and labeling standards as far as MCC, LCUS, and SUS are concerned.
Upgrade to PDAs We decided to use a PDA with the route sheets to ease the transfer of route list data to a PC file. We hoped that this would eliminate the reams of paper being carried in the field to record field notes.
With the first model we tried, we would load one route list at a time, make changes in the field, and then merge the data with a PC file back at the office. However, the processing power of the unit proved to be inadequate for the size of our routes.
The second PDA model provided greater processor power, which allowed us to upload multiple routes, make changes in the field, and then merge the data with a PC file in the office.
This was our first significant efficiency upgrade to the program.
While the development phase of the program was being completed, two other portions of the program, Web-based Machine Condition Summary Pages and integration of the data with our CMMS, were being constructed simultaneously.
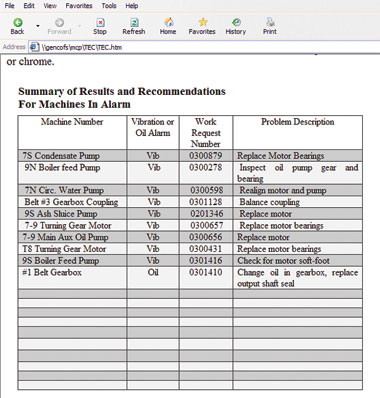
The Web-based summary pages were also designed to emulate the vibration and oil technologies pages that were already implemented (Fig. 2).
Development of standards During the initial 12-month implementation of the thermography program it was imperative that we develop a group of standards and procedures under which we would operate the program. The following standards and procedures were developed using Snell Infrared guidelines, along with Infraspection Institute and Military Standard MIL-STD-2194(SH):
• Westar Energy IR Camera Set-up
• Westar Energy Indoor Electrical Systems
• Westar Energy Outdoor Electrical Systems
• Westar Energy Mechanical Systems
• Westar Energy Radiometric Temperature Measurement
• CBM Severity Guideline
The last guideline also interfaces directly with our CMMS priority matrix as shown in Table 1.
| Temperature Rise in F | Nonoutage Priority Code | Nonoutage Priority Code Description | Outage Priority Code | Outage Priority Code Description |
| > 80 F |
5 | Emergency: Immediate response required, work to completion |
5 | Outage/Urgent: Problem dictatesoutage/reduction ASAP |
| 40-80 F |
4 | Priority/Expedite: Start next scheduled shift, work to completion |
4 | Outage/Critical: MUST complete at next available outage |
| 20-40 F |
3 | Maintenance/Routine: Plan, schedule and complete in 30 days |
3 | Outage/Routine: Complete at next scheduled outage |
| 10-20 F |
2 | Maintenance/Noncritical: Completion within 60 days |
2 | Outage/Noncritical: Suggest nextoutage, can be deferred |
| 0-10 F |
1 | No production impact, completion required 120 days or less |
1 | Outage: Schedule for undetermined future outage |
More applications added
As the program continued through its inception, acceptance, and growth stages, we experimented with a number of other applications besides electrical distribution. The objective was to evaluate these applications and find the one(s) that would be most beneficial to our program. As a result, several applications have been added to the overall thermography program.
Boiler inspections were conducted on an annual basis. A baseline for every boiler within the facilities was first conducted during the winter months of 2002-2003 and then follow-up imaging took place during and after temporary refractory repairs were made, especially with our forced draft/positive pressure units.
Steam trap inspections were first used to confirm ultrasound findings. Once the first report was issued containing thermal images this became another application that was regularly used by the generation stations prior to their outages. Images are also provided of defective traps.
Mechanical applications are currently in the development stage for full implementation during the 2004 inspection periods. This inspection will be a baseline inspection to establish current thermal signatures on each motor and the component associated with it for specified equipment throughout each facility. Once a baseline has been established, thermography will be used as a follow-up technology to vibration and oil technologies. In other words, infrared will be used on an as-needed basis for the majority of the rotating equipment within our plants.
Experiments in other areas A number of other applications and experimentations have been tried at Westar Energy. They include but are not limited to mechanical applications such as coal transport belt idler bearings, motor bearings, motor housing temperatures, and fan and pump bearing temperatures; process inspection such as fluid flow with condensers and oil coolers; roof imaging for moisture infiltration; and cooling tower imaging to assist with water flow efficiency. We also went through installation and evaluation of infrared transmissive windows in certain medium voltage switchgear. The results of our experiments varied with each application.
Bearing and motor housing temperature evaluation is a somewhat standard application and is being implemented into our program as mentioned earlier. The transport belt bearing temperature application is still under review. We currently have a number of idler pulleys from our coal transport system being rebuilt. Once the root cause and visual bearing deterioration inspections confirm our findings, the information will be used to further evaluate the use of infrared technology for this application.
The cooling tower flow application has had limited results to date. Although it has been determined that a full cooling tower study would be somewhat helpful, it is extremely difficult to get consistent results. This is due to such factors as the ambient environment, time for staff to devote to a thorough study, and various other projects that have come up through the year.
Our fluid flow experimentation has had limited results to date with some of the same issues again coming into play as with the cooling tower application.
Our roof imaging has shown good results. We will likely continue, on a limited basis, built-up roof (BUR) thermal roof inspections.
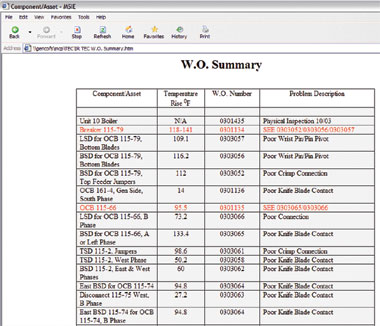
The installation and evaluation of the infrared transmissive windows has had mixed results. Initially these windows were installed on both 4160 V and 69 kV switchgear. Cabinet measurements were taken and confirmed with the plant engineering staff. Installations then started on a chosen few units during respective outages. After the units were brought back on-line, imaging through the windows was conducted to determine their viability for our program (Fig. 3).
Total Thermography Images to Date
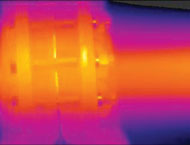
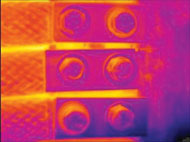
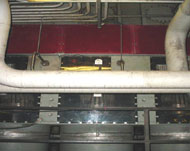
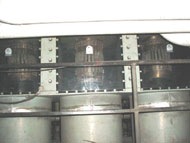
Fig. 3. One of the other applications Westar tried was the installation of infrared transmissive windows in 4160 V and 69 kV switchgear during outages. After the units were brought back on-line, imaging through the windows was conducted to determine their viability for the program. These images were taken from generator bushing boxes, immediately below the main generator.
Three important factors came into play. First, installation location is critical and specification by the thermographer must be followed for proper installation. Installations not compliant with the specification can have an unfavorable impact on the value of the window to the thermographer, specifically as it applies to field of view (FOV) and depth of field for the infrared camera. Second, the transmissivity of the windows we chose to install was excellent with our long wave imager. And third, if you are using a product such as InsulBoot, your ability to image the actual termination points in the given cabinet will be severely limited.
What lies ahead As stated earlier, we are putting together a full baseline mechanical study. We are continuing with the development of various process applications and exploring the use of thermography in both our coal piles and coal bunkers.
Our own in-house infrared Level I certification program was rolled out this year. The first class has finished, and all attendees completed their in-house certifications. We have also slated personnel for Level I ultrasonic technician training and certification, which will be folded in with the thermography portion of the PdM program. Personnel also have been cross-trained in motor testing and analysis.
Westar is currently evaluating the implementation of a new database and route collection system. This new component to the infrared program will allow for Web-based tracking and trending of all infrared projects and will greatly enhance the efficiency of our program. It will also allow for simultaneous imbedding, reporting, tracking, and trending of the ultrasonic technology being brought into the thermography program.
In summary, Westar Energy’s experience has amply demonstrated that, given strong management commitment, combined with the assembly of a technically competent, dedicated team, significant value can be added to the maintenance function in a short time frame.
Carl Schultz is PdM manager, thermography, at Westar Energy, Lawrence Energy Center, 1250 N. 1800 Rd., Lawrence, KS 66049; (785) 331-4772
Related Articles
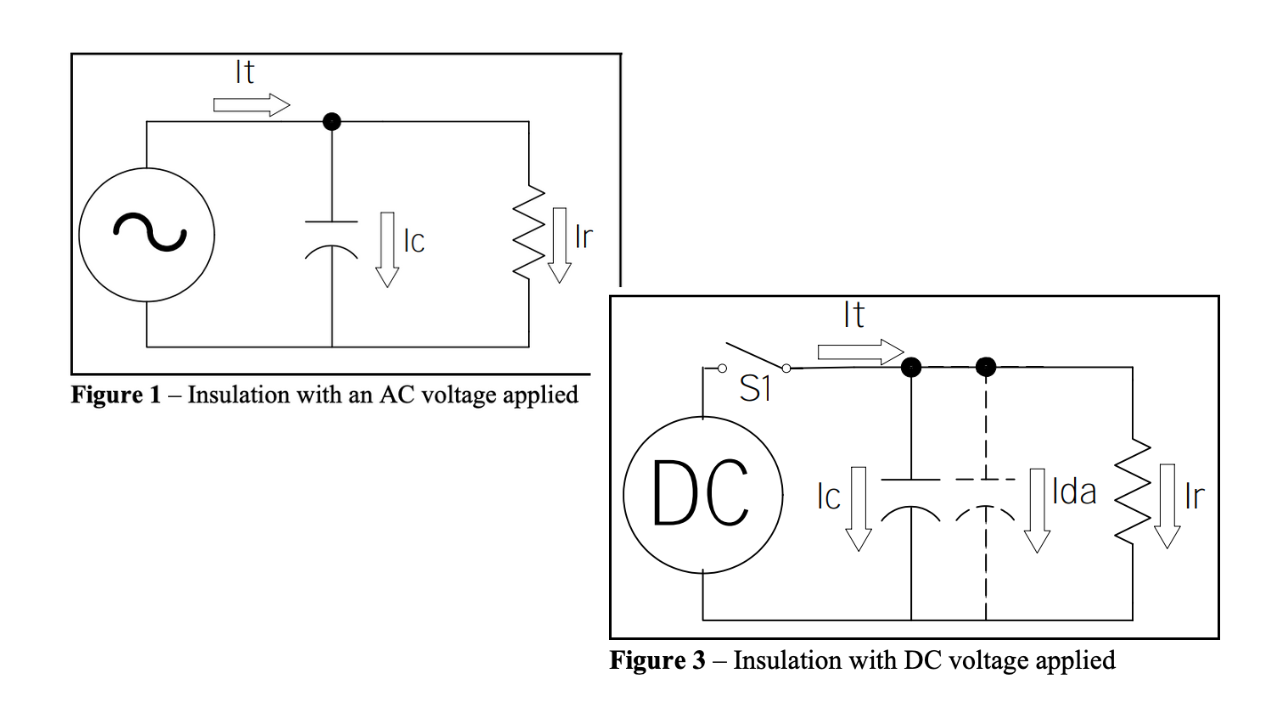
Principles of Insulation Testing
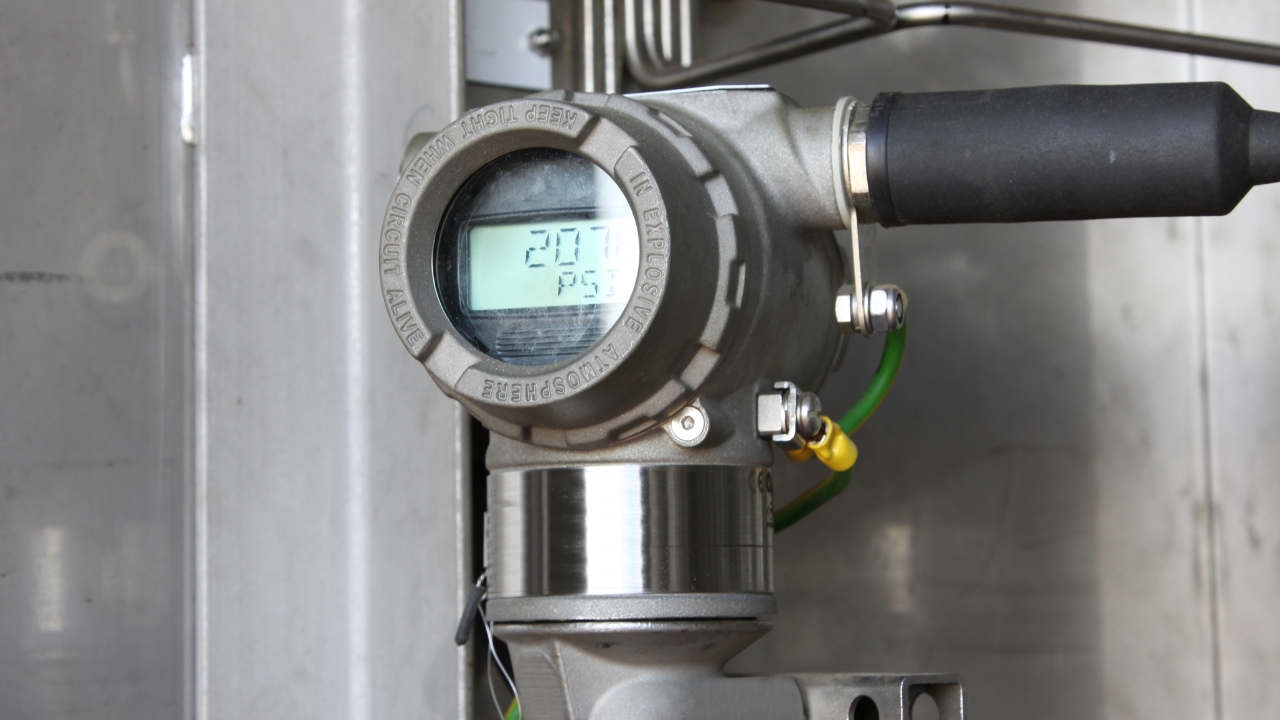
Top Tips for Selecting Pressure Measurement Transmitters
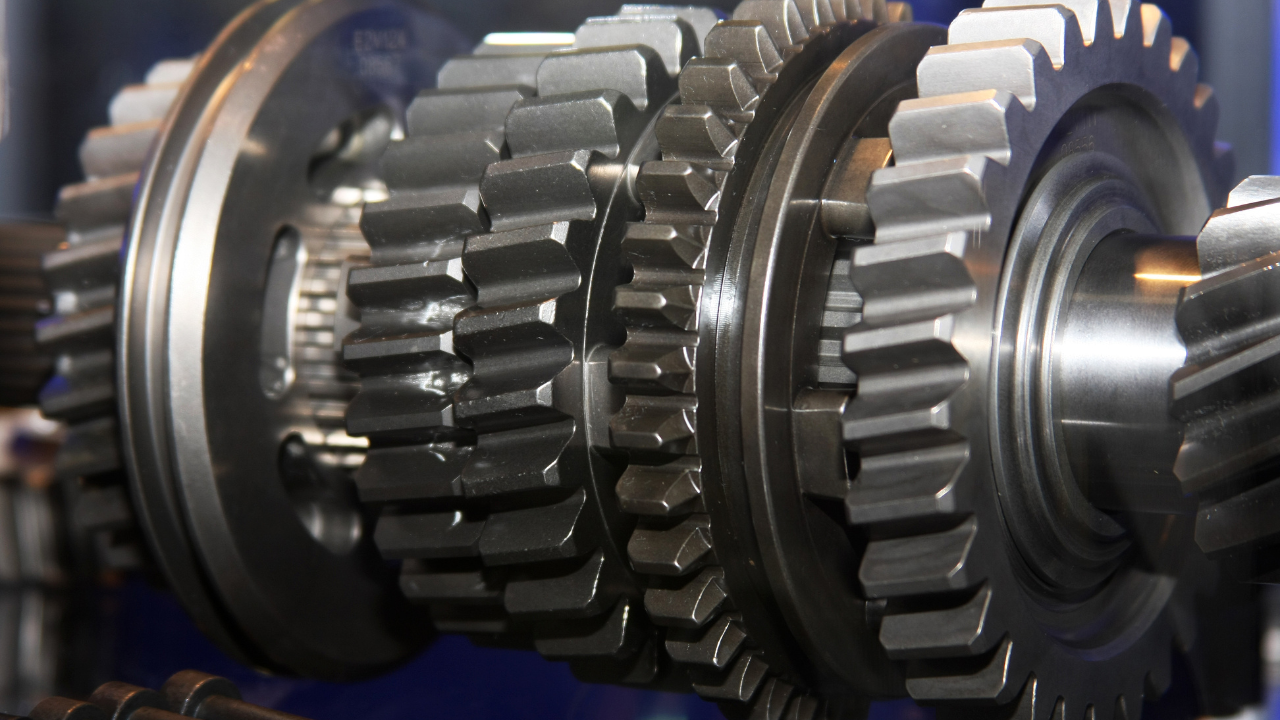
Gearbox Diagnostics Fault Detection
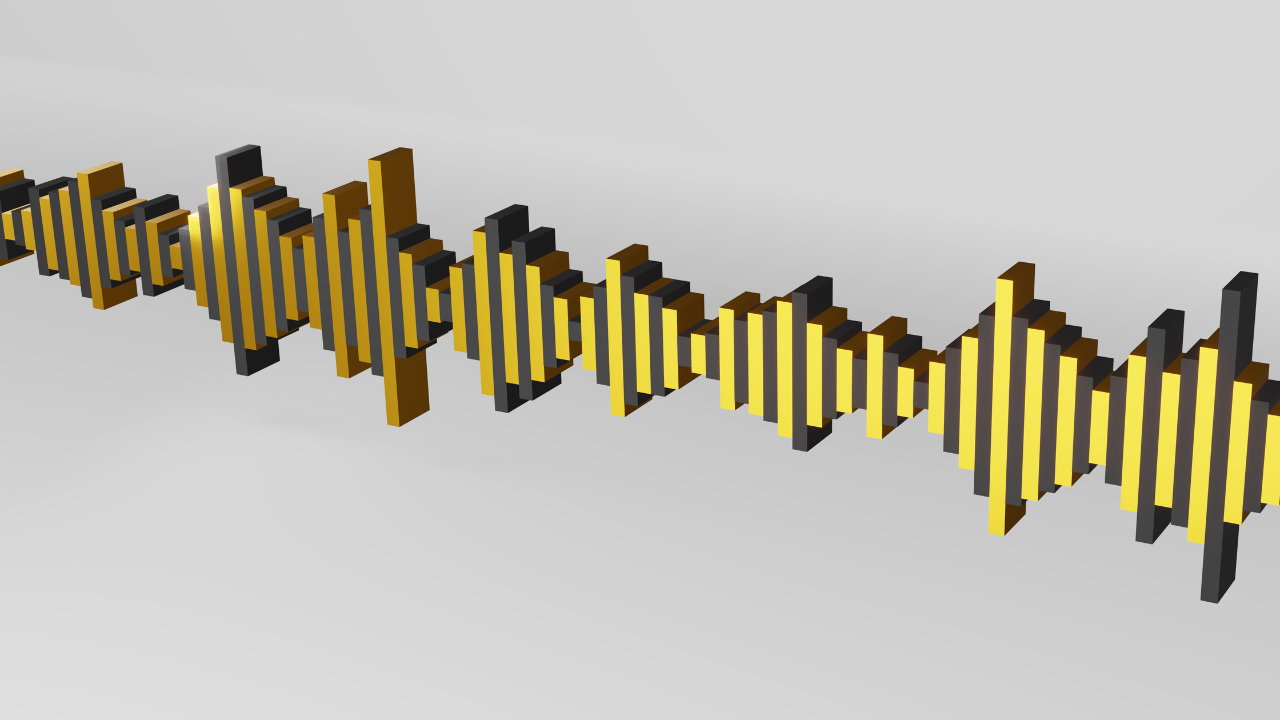
What is Vibration?

Why Record? Infrared Video
What You Should Know Before you Buy – A Guide to Buying an Infrared Camera