A Twist on Particle Evaluation: Redefining the ISO Cleanliness Code
Matt Spurlock
For over 20 years, users of oil analysis have used the ISO cleanliness code to help determine solid contamination levels in both new and used oils. The current ISO standard for reporting cleanliness is ISO4406:99. Using this standard, analysts and end users alike have managed to establish cleanliness goals and develop key performance indicators (KPIs) with the expectation to allow for preemptive action to avoid early machine damage. While this has produced some success, relying specifically on the ISO cleanliness code as it is currently reported has its limitations.
This is a proposal to rethink how industry uses particle count data in oil analysis for condition monitoring purposes. This article will focus on the vagaries of the ISO4406:99 reporting standard and review the difference between a reporting and a calibration standard, present the weakness of the reporting standard as it is currently used and consider the weaknesses via a case study.
Calibration vs Reporting Standards
Particle counters are delicate instruments and their precise performance can be a challenge to maintain. Accordingly, frequent and careful calibration is necessary to validate the instruments’ continued accuracy. Automatic optical particle counting calibration follows an established standard, which is ISO11171. This standard dictates that automatic particle counters are calibrated to accurately measure particles in accordance with the following values:
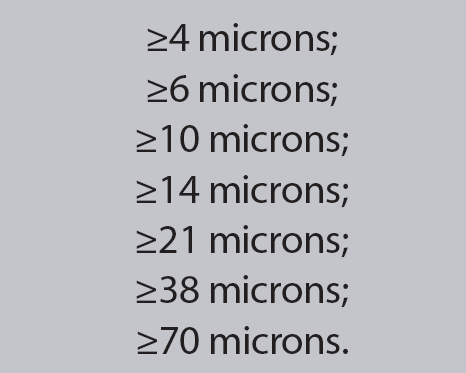
When reporting particles at the size ranges listed, it warrants noting that the particles measured at greater than or equal to four (≥ 4) microns include ALL particles four microns and greater in size. For the next level, ≥ 6 micron, only those particles five microns and less are excluded. Those particles that are six microns and greater are counted and reported. This holds true up the entire ISO calibration range.
By measuring and reporting these values, the end user can have an overall understanding of solid particles lingering in the oil. Monitoring these values also can help confirm the potential presence of large wear particles that cannot be seen through other standard test methods. Of course, particle counting alone simply indicates the presence of particles and does nothing to indicate the type of particles present.
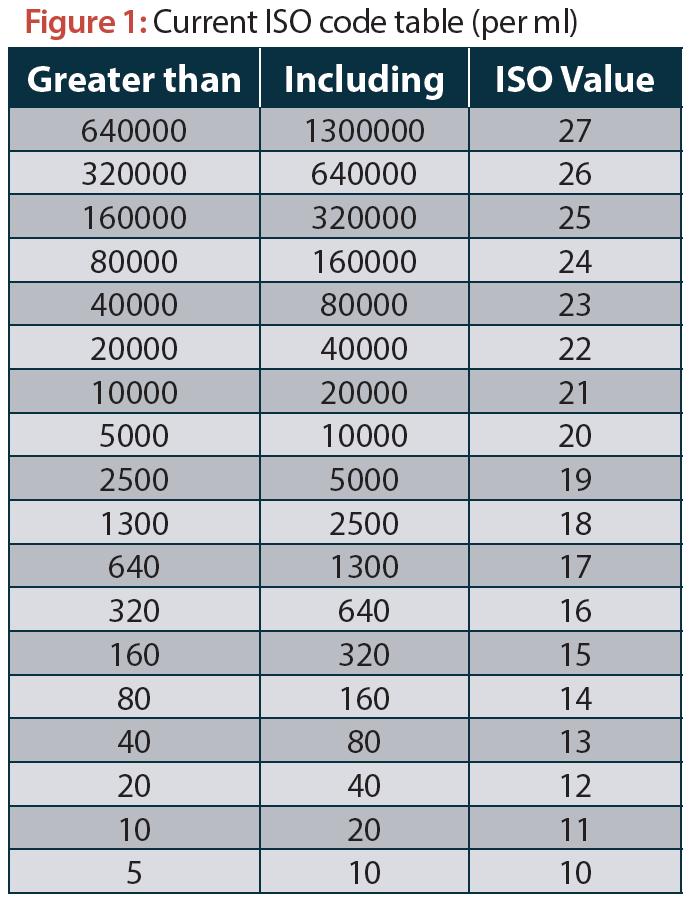
The reporting standard, as previously mentioned, is ISO4406:99. In accordance with this standard, the values used from the particle count data are related to the >4, >6 and >14 micron levels. The raw data at these micron levels are compared to a standard table and then translated to a code value. (Figure 1). By using the code, it is much easier to develop target values and report KPIs.
It’s important to understand the concept behind the ISO code table, referred to as the Renard’s series table. The maximum value of each level is approximately twice the value of the preceding level. This means the minimum value
of each level is also nearly double the minimum value of the preceding level.
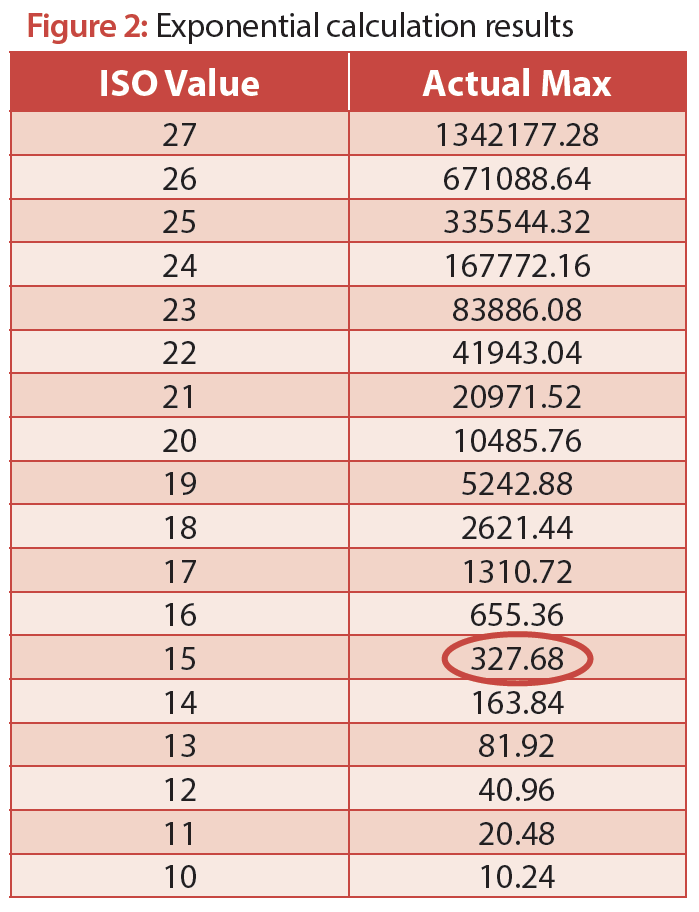
This is accomplished by using the ISO code, which is a value that is an exponent of two, dividing that result by 100 and then doing a bit of rounding. Figure 2 shows the actual exponential calculations for each code value. This provides the maximum number of particles that a given code value can contain. For example, consider the code of 15.2 to the 15th power equals 32768. This value divided by 100 equals 327.68. For the purposes of simplicity, this value was rounded to 320. So, for any micron level with a code of 15, there will be a number of particles greater than 160 up to and including 320, as shown in Figure 1.
By following this method, it is easy to understand why the rule of thumb is: For every increase in an ISO code value, the possible number of particles doubles. At face value, it appears the code provides the user with a convenient grip on the nature of changes in the solid particulate concentrations in the oil.
There are some characteristics about the code that can create a false sense of security. For instance, due to the discrete range of values at each code level, the actual number of particles can increase significantly without ever registering a code change. At the same time, there also can be just a slight increase in raw data that causes the ISO code to increase, giving the appearance that the contaminant level has doubled. It also should be noted that an increase in nearly four times as many particles can result in an increase of only a single ISO code value.

It is this reason that the current ISO code, as written and reported, has limited usefulness for proactive data evaluation. In the current format, the ISO code is a useful performance indicator and reporting tool, however, the lack of structure for true particle trending allows for a less than robust proactive contamination monitoring tool. Until now, the only true way to monitor cleanliness trend is via the raw data itself, which can be daunting given the amount of raw data and numerical ranges that are sometimes provided. This can be especially true for those laboratories that report particles per 100 milliliters of sample versus reporting particles per milliliter of sample.
The Solution
While the intent of the ISO code is to allow for easy reporting and tracking by aggregating data, the reduction has gone too far. As previously suggested, it is important to understand how far into the next ISO range the samples have progressed. This can be accomplished by dividing each range into 10 parts and inserting a single decimal point into the code, thus providing a better view of change in the particle count volume without having to look at the actual raw data. Taking this very simple approach can help drive the decision of whether corrective action is warranted.
Let’s look at this proposition as it relates to the ISO code level of 20. In its current form, if the number of particles at a given micron size is greater than 5000 particles/ml up to and including 10,000 particles/ml, for that particle size, there is a range of 5000 and it is assigned a value of 20. If the range is divided by 10, there are 10 equal parts that have a 500 point value difference.
For example, assume target ISO code value at the >6 micron level is 20. If there are two samples in a row that report an ISO code value of 20 at >6 microns, then there is a perception that the system is fine. Most people wouldn’t even look at the raw data because the 20 would not be at any alarm level. But what if the first sample is a 20.2 and the second sample is a 20.9? Would it warrant taking proactive action at this point? As this is a significant increase in particle values, it would, indeed, warrant some type of corrective action.
Let’s look at the following real-world lab data to understand the significance of this proposed process.
Case Study
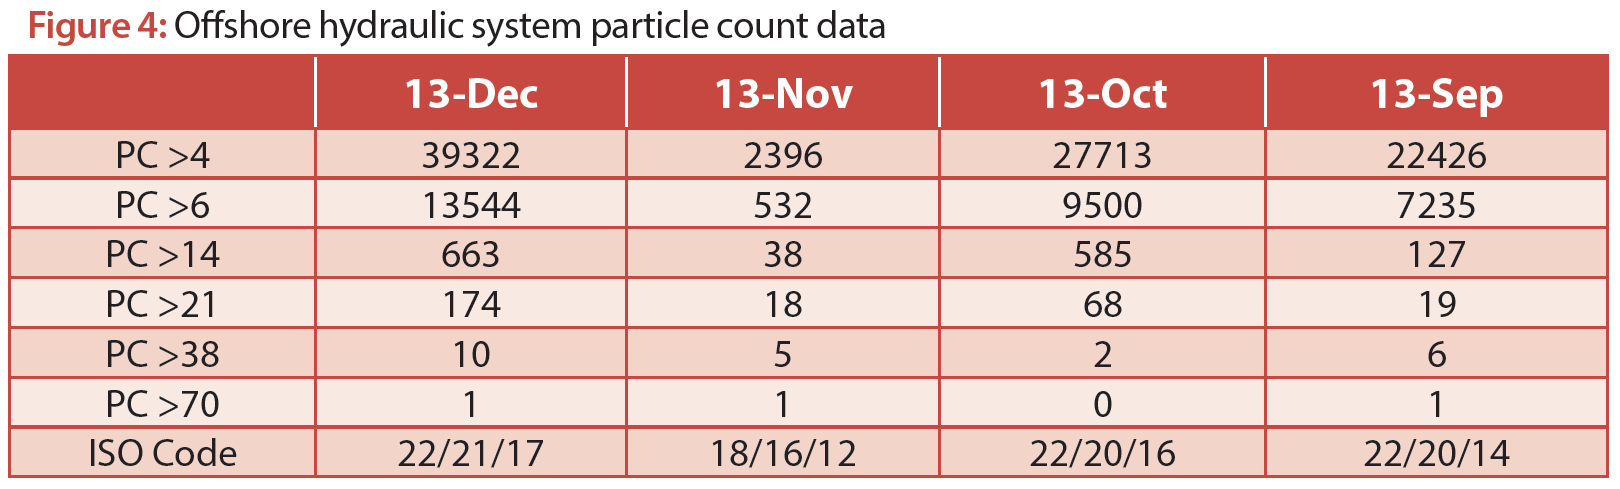
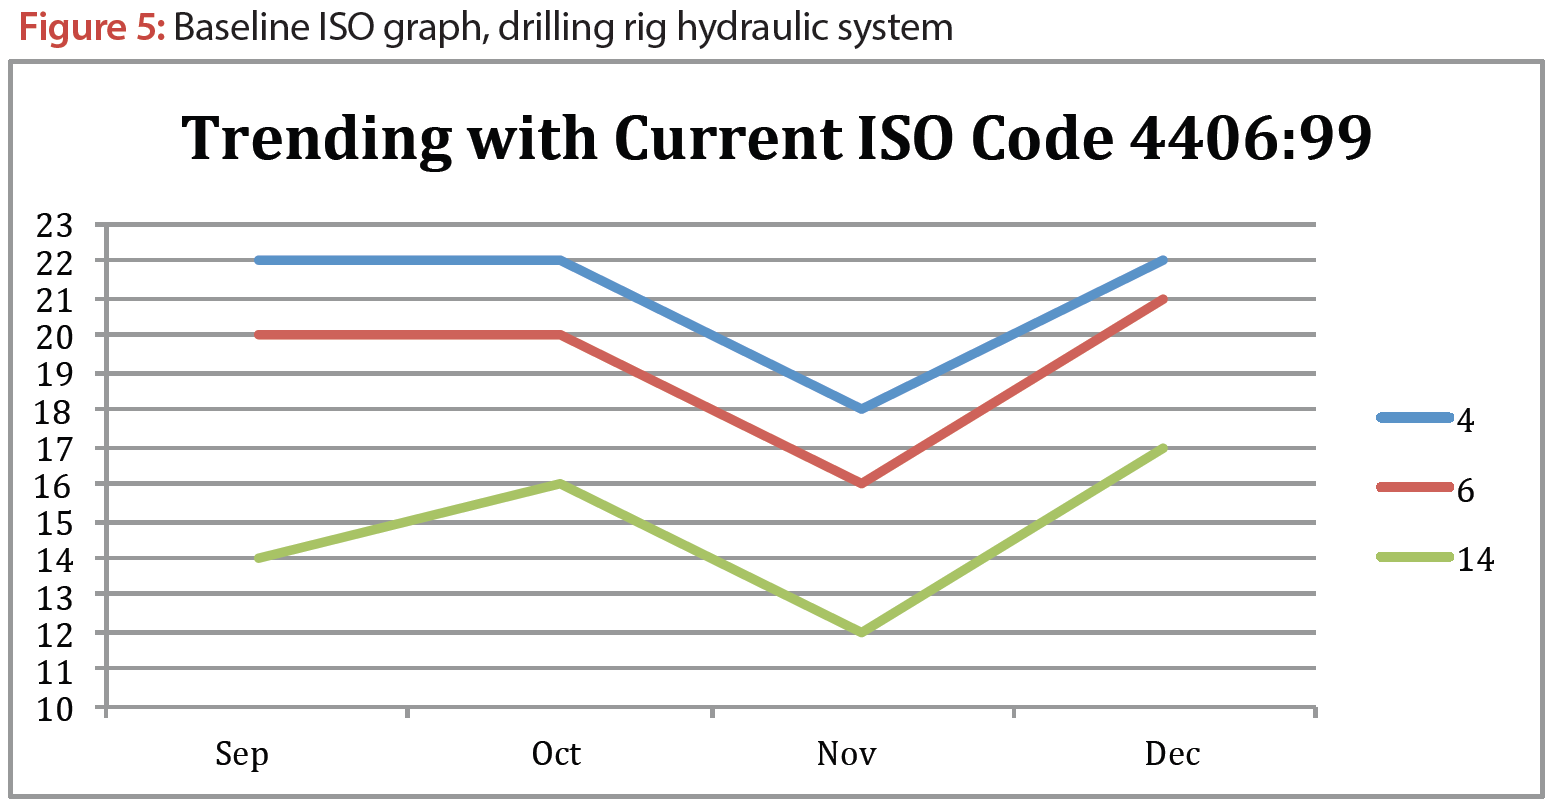
A drilling platform has been consistently sending oil samples for several months. The overall program is considered to be at mid-level quality. The data shown in this study is from a hydraulic system powered by a gear pump. For the purposes of this study, only the data related to particle count and the ISO cleanliness code for the last four samples are required.
Using the data in Figure 4 and reviewing Figure 5, it is easy to see that there was a significant change in the November 2013 sample. In the December sample, it appears that the particle count values came back to the historical trends at the lower micron levels. What isn’t evident, however, is the actual trend of those lower micron levels and the overall severity of the >14 micron level.
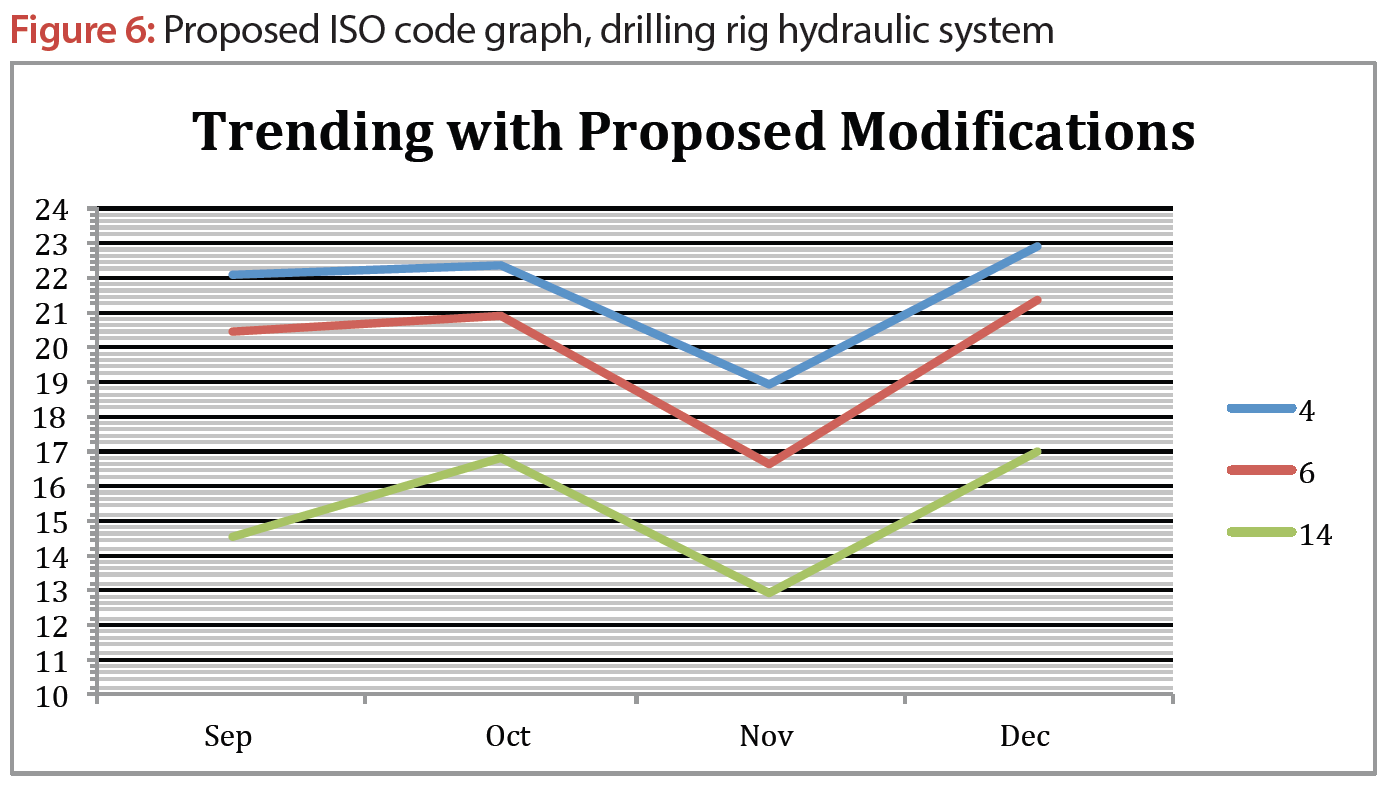
When you refer to Figure 6, which is consistent with the new proposed reporting structure and breakdown, you can quickly see that it is possible to report the true trend of contamination without the need to monitor the raw data provided by the particle counter. By using just the ISO code as it stands today, it is evident that there was an increase in particles, but it is only evident at the >14 micron levels. By subdividing the ISO code values, you can see that the increase in particles is much more pronounced than the current ISO code indicates.
How This Affects You
By breaking down each code range and adding just a single decimal place, condition monitoring professionals gain the ability to accurately track where the trend is going without having to manage what could be an extraordinarily large amount of raw data.
Conclusion
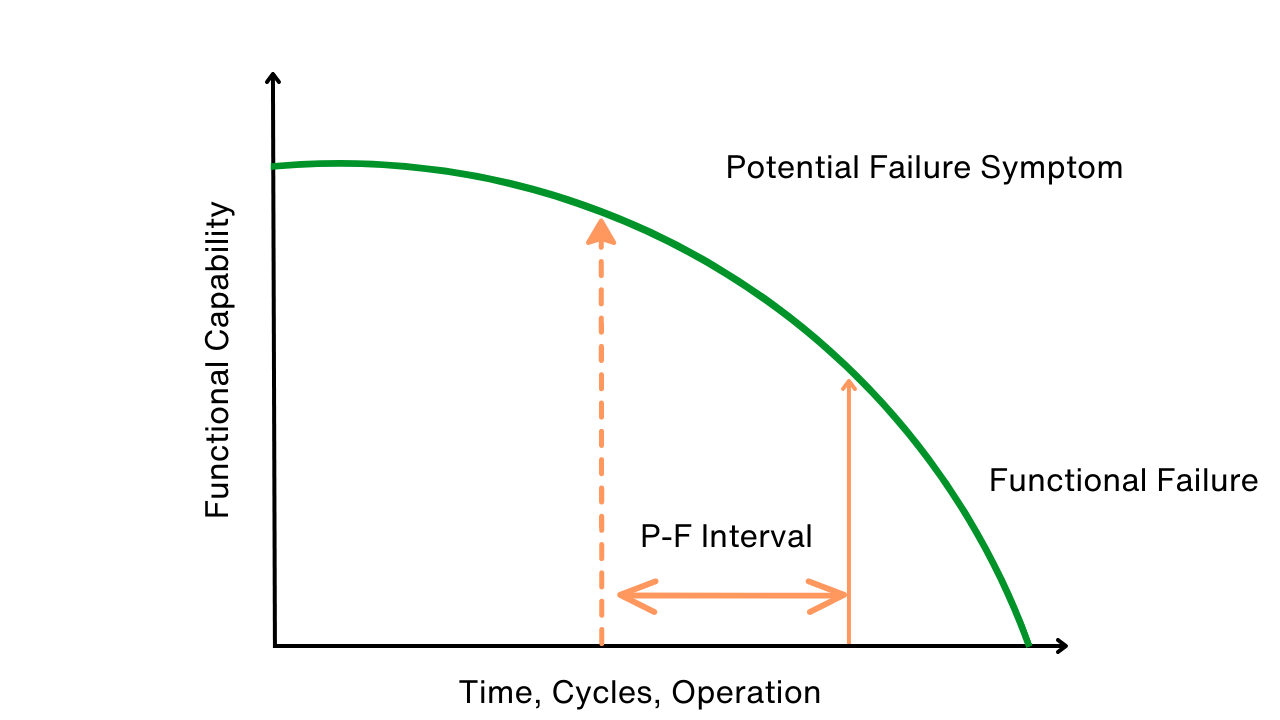
The goal of particle contamination measurement is to monitor the condition of the oil for corrective action before the lubricated components reach point P on the P-F Curve. The ISO cleanliness code, as it stands today, provides a means for partially achieving this goal. However, with this simple modification, the technician will be able to see changing directions clearly and quickly, and do so without becoming overwhelmed by numerical data. The value of the cleanliness coding system for KPI target setting and trending would remain, and its utility as an analysis tool would be markedly improved.
Particle count sample data courtesy of Fluid Forensics
Particle count ranges developed by M. Spurlock
Matt Spurlock is vice president of business and technology development for Advanced Machine Reliability Resources, Inc. (AMRRI), a Tennessee-based machine reliability consulting firm. Matt has over 20 years in oil analysis program management and data interpretation, and over 10 years developing and managing industrial lubrication programs. Matt was a contributor to both the ISO18436-4 and ISO18436-5 committees for oil analysis training and lubrication requirements, and maintains multiple certifications in lubrication, oil analysis and equipment reliability.
Related Articles
Use P-F Intervals to Map, Avert Failures

The RCM Trap


Can You Really Justify Reliability Centered Maintenance (RCM)?

Design for Maintainability